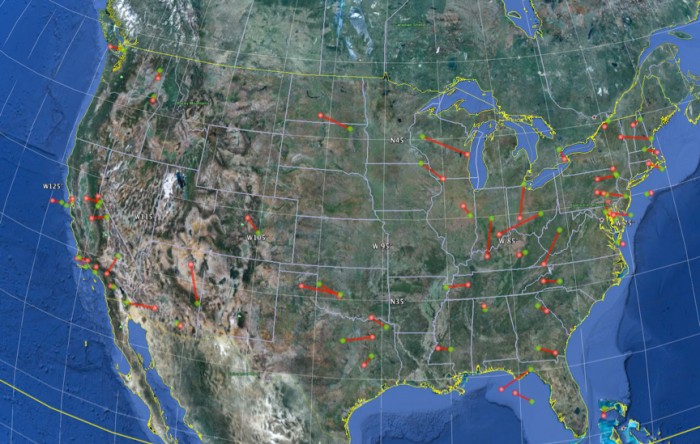
The American Meteor Society has published a statistical analysis of fireball events reported to the society since 2005. This report is not intended to be a conclusive study regarding the rates of fireball meteors, but simply a representation of the data logged by our systems. The article also includes an appendix of the most significant sonic boom producing bolide events reported to the society over the last 8 years.

Significant Sonic Boom Producing Fireball Events Logged With the American Meteor Society from January 2005 through February 2013.
This document, The Analysis of a Citizen Science Based Fireball Tracking System is available for download in PDF format or HTML (with the Appendix).
An Excel worksheet containing the raw data used in this study can be downloaded here: AMS Fireball Events XLS
A Google Earth KML file containing the estimated trajectories of the significant AMS events from 2005-2013 can be download here: Trajectory Estimates for Significant AMS Events 2005-2013. (KML file provided in zip format and must be unzipped. File can only be used with Google Earth. You can download Google Earth for free here.
Trajectories modled in this KMZ file are only estimates determined by calculating the intersection points of all witnesses and then averaging these results to determine the starting and ending points of the fireball. The model’s margin of error varies based on the accuracy and location of witness reports. We continue to make improvements to the trajectory modeling algorithm and data collection methods.
Questions regarding this study should be sent to AMS Operations Manger Mike Hankey. Mike can be reached at mike.hankey@gmail.com
 American Meteor Society
This is the same subject that comes up a lot with earthquakes. Why does it seem that there are so many lately? Is there an increase? USGS says no. Its just the publics perception of them has increased because of instant worldwide news reporting via internet, twitter & facebook. Everyone has cell phones & camera now a days. Surveillance cameras are everywhere. All-sky cameras are getting cheaper & cheaper and more amateur astronomer friendly. Asteroids on near Earth collision orbits are regularly making the news. Would the Russian meteor/meteorite have made the news 10 years ago? Probably not, atleast not instantly, and not with 20 or so different camera views instantly posted on Youtube. How many movies have come out in the last decade or so of doomsday comets & asteroids? News of your website and reporting “program” has also increased over the last few years. I for one, had never heard of it before about 5 years ago. So are meteors actually increased in numbers or methods of reporting them increased? I vote the latter. (P.S. Great work however compiling all the information together, it is still interesting that the majority of the sightings are still over populated areas, i.e., more eyes, more sightings)
Marc, Thanks for the comment! Yes we can only conclude that more people are seeing and reporting meteors to the AMS. All of the factors you mention are contributing. While improved exposure and software do help generate more reports, we still can’t make rocks fall from the sky 🙂 That being said, it is natural for fireball rates to fluctuate from year to year. The AMS fireball reports is not a controlled environment so we can’t make any conclusions about the increases in events reported to the society. However the DOD systems should be able to do this.
Thanks for collecting this Mike. Any recent news on the DOD providing access to their data or how it will be released?
Awesome report and KML, Thanks Mike!
No offense, but why come on to a scientific based website, make the claims that you did and refuse to cite any proof or sources? Are you a government agent? Are you not from this planet?
Hey Bob,
Not sure who you are addressing, but all of the data that backs up our analysis is published on the site and an xls of this is linked on the page. You can review all raw data in the fireball logs. Perhaps I am not understanding your complaint, if so please clarify.
Thanks,
Mike Hankey
Are there any updated charts showing the fireball activity for 2013 and 2014?
Ross and All,
Actually we have all been too busy to provide an in depth review of recent fireball activity. We can only provide generalizations without the necessary research. My inclination is that fireball activity has remained the same the past 2 years. We will try to provide more hard data when we have more time.
Robert Lunsford
When are you going to update your graphs? They all end in 2013.
Claude,
Visit: http://www.amsmeteors.org/members/imo_fireball_stats/
You will find updated graphs on fireball data there.
Robert Lunsford