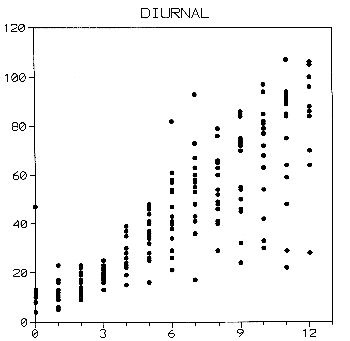
FIGURE 5.2

AMCA is intended to be run for at least one year in order to sample the rate of meteor influx all along the Earth's orbit. At the writing of this document we have come to the time when system development has stabilized and data recording can begin. This section shows the format and form of the data we are acquiring.
Figure 5.1 shows the format of the output in a typical hourly data file. The first lines contain the process and header parameters. The remainder of the file lists summaries of hourly sampling. The date and time of each counting interval are in the left hand columns, and refer to the middle of the time interval in Easter Standard Time. This is followed by the average signal power in dBm, the quiet time in percent, and the average reference audio correlation in percent. These data allow characterization of receiving conditions during the counting interval. The next three columns contain the false, long, and meteor counts. The meteor counts include both long and short echoes. The rightmost column gives the data quality flag.
The first test of a meteor counter is observation of the diurnal variation in meteor rates, with higher numbers coming in the hours around 6 AM local time and a minimum occurring near 6 PM. This is due to the observer being located on the side of the Earth facing the apex of it motion in the morning, and vice versa in the evening. Figure 5.2 shows hourly rates with 6 PM on the left and 6 AM on the right, and demonstrates that AMCA has detected the diurnal variation.
Trigger Size            3   dB
Quiet Signal         -127   dB  0 = off
Audio Increase          0   % correlation
Long Duration          10   0.1 sec
DB offset               0   dB
Megahertz         61.24
Band              LSB
Antenna           BEAM
Beam Pointing     315
Radio             R8500
Squelch           OFF
Lock switch       ON
Noise blanker     ON
BFO frequency     .33 KHz
IF shift          0
Atten/Gain        0
AGC speed         FAST
Audio filter      OFF
Quality Flags:
-2: flagged manually as bad
-1: meteors < 2 * false or quiet < 50
 0: OK
+1: flagged manually as good

 <--  MID TIME  -->  <----  AVERAGE  ---->   <------ COUNT ------->  QUL
 MO DA YR  HR MN SC  SIGNAL  QUIET   AUDIO   FALSE    LONG   METEOR  FLG
 ========  ========  ======  ======  ======  ======  ======  ======  ===
  2  1 97   0 33 59   -127      93      11       0       6      47    0
  2  1 97   1 33 59   -127      93       9       0       2      57    0
  2  1 97   2 33 59   -127      91       9       1       6      66    0
  2  1 97   3 33 59   -127      93       8       0       9      74    0
  2  1 97   4 33 59   -127      91       8       0       9      79    0
  2  1 97   5 33 59   -127      92      18       1       5      84    0
  2  1 97   6 33 59   -127      87      17       3       6     100    0
  2  1 97   7 33 59   -127      87      19       2       3      85    0
  2  1 97   8 33 59   -127      79      21       4       7      81    0
  2  1 97   9 33 59   -127      78      22       2       8      84    0
  2  1 97  10 33 59   -127      89      17       1       3      54    0
  2  1 97  11 33 59   -127      88      18       1       4      48    0
  2  1 97  12 33 59   -127      90      18       0       4      47    0
  2  1 97  13 33 59   -127      93      16       0       3      37    0
  2  1 97  14 33 59   -127      92      19       1       0      24    0
  2  1 97  15 33 59   -127      95      17       0       5      22    0
  2  1 97  16 33 59   -127      94      17       1       1       9    0
  2  1 97  17 33 59   -127      92      20       1       2      11    0
  2  1 97  18 33 59   -127      91      22       0       0       8    0
  2  1 97  19 33 59   -127      94      21       0       1      12    0
  2  1 97  20 33 59   -127      96      19       0       1      14    0
  2  1 97  21 33 59   -127      96      16       0       2      17    0
  2  1 97  22 33 59   -127      96      11       0       3      26    0
  2  1 97  23 33 59   -127      95      15       1       2      36    0
